Understanding your email statistics report graphs
Your guide to pathway services
For more information please refer to the sample Operations Analysis Report here.
Contents |
Total number of emails received per mailbox (over the past month)
The graph below shows the five mailboxes that received the most emails over the past month. You can use these statistics to gauge whether you should increase your mailbox sizes.
Total number of viruses detected over the past month
The graph below shows all the viruses that we detected over the past month. If any of your mailboxes (that are hosted by us) detected any viruses, this would be displayed in the graph.
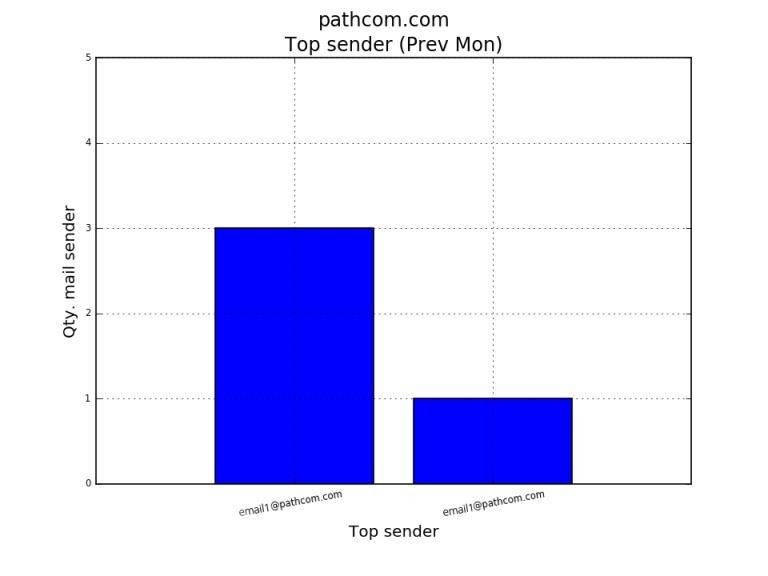
Top five email senders
The graph below shows the email addresses that send the most email to your domain.
Total inbound data consumption over the past month
The graph below shows your domain's total inbound data consumption for the past month.
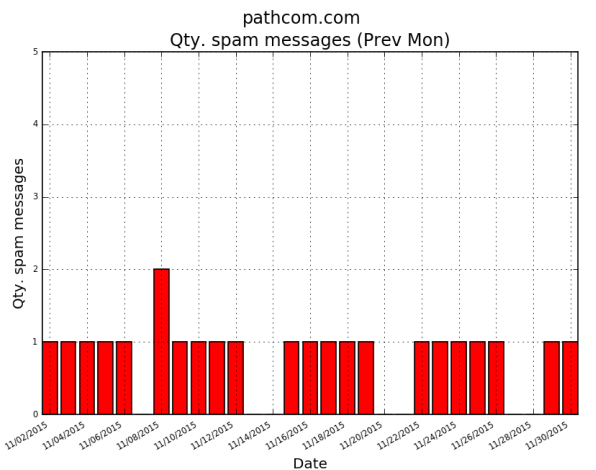
Spam total for the past month
The graph below provides a daily snapshot of the total amount of spam that mailboxes on your domain received over the past month.


